Posts tagged distribution-chart

Android distribution August

Android fragmentation is still an issue, and M’s launch will further complicate the situation. Photo: Google

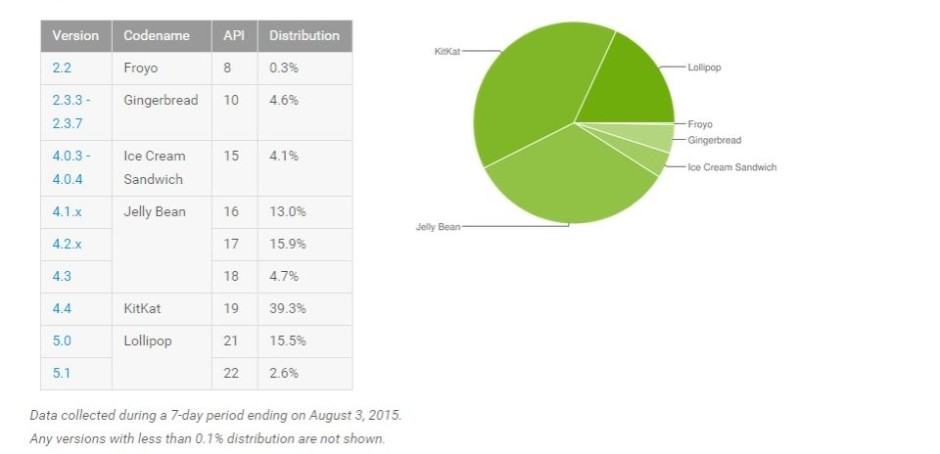
It’s a long way to the top for Android 5.0 and 5.1 Lollipop, which account for a combined market share of 18.1 percent, according to the latest OS breakdown figures posted by Google. Meanwhile, last year’s flavor of the day, 4.4 KitKat, rules supreme with an unflinching 39 percent of the pie.

While I should be used to this by now, I just can’t help but feel depressed every time a new Android distribution chart comes out. You see, way too many devices are left running outdated versions of Android and it’s really the average consumer who ends up getting the shaft.

Boy has it been a slow road for Android 4.0, and while the numbers are still dismal, Ice Cream Sandwich is now populating the second highest number of devices accessing the Google Play Store. Gingerbread remains the majority leader with 60.6% of Android devices running it — quite sad considering it’s almost two years old.

The latest Android distribution numbers are out, reminding us why we prefer Nexus devices. Although the number of Android 4.0 devices nearly doubled since last month, they remain embarrassing low. It’s been six months since Ice Cream Sandwich melted its way into our hearts yet only 4.9% of Android devices accessing the Google Play Store were running it.